Rural and Urban School Districts Fighting Together
a look at poor rural districts the cities should organize with

Part of the MLF strategy is putting together a coalition of urban and rural school districts to demand better terms. The urban-rural divide is one of the most powerful divisions in the country right now, along which racial, political, and other demographics differences also fall.
Yet there’s something that connects rural and urban school districts: lack of revenue.
Urban districts have low property taxes stemming from segregation and low state and federal effort, lowering their revenues. Rural school districts suffer from a lack of revenue due to low population density.
During an organizing conversation about the MLF and school funding, I got a really interesting question: What are rural school districts’ financial situations in Pennsylvania, and who might be most likely to enter a coalition fighting for better MLF terms?
The Center for Rural Pennsylvania is an obvious resource here. They provide a pretty extensive school district list with data from 2018.
Another is the recent report published by the commission to reform the state’s school funding formula in 2015. The report has a section on small rural districts and includes testimony from representatives of those districts who speak to their struggles.
We could also look at the Public Interest Law Center’s case against the Commonwealth that it’s in violation of the education clause in the constitution. The Pennsylvania Association of Rural and Small Schools (PARSS) is one of the plaintiffs bringing that suit. (Organizers could consult with PARSS to see if they might be interested in pursuing the MLF strategy.)
PARSS has a helpful diagram with some basic numbers on rural school district funding. Of 260 rural districts, 202 don’t receive a fair share of funding. Many of these districts fail to meet adequacy targets.

The report provides some stark contrasts with other school districts:
For example, in western Pennsylvania, per student spending in Blair County’s Claysburg-Kimmel School District is $6,585.90, less than half the spending at Quaker Valley School District in Allegheny County, which is $13,703.97.
In the east, per student spending at Mount Carmel School District in Northumberland County, $6,581.64, is dwarfed by the spending at Lower Merion School District outside Philadelphia, which reaches $17,408.80 per student.
Why the disparity?
Economies of scale
In the funding formula testimony we find out that half of the rural school districts in PA enroll a quarter of PA’s students, whereas half of urban/suburban schools enroll the other three quarters. Basically, there are way fewer students in the rural districts compared to suburban and rural areas.
These districts are really small. PA has 500 school districts. Twelve of these enroll fewer than 500 students. That’s not a school we’re talking about, it’s the entire K-12 district. Here’s a list from 2013-14 of average daily membership in the PA’s smallest districts.

Some of these tiny districts in terms of students are the largest in the state in terms of geography. Forest Area School District enrolls 551 students and covers 503.9 square miles. Sullivan County School District enrolls 652 students and covers 452 square miles.
That’s a lot of ground to cover. The problem of transportation comes up in this situation. With fewer students, the rural school districts are allotted less funding (since funding is partially determined by head counts, or ‘per pupil’ as the lingo has it).
Yet they have greater transportation costs due to their geographical size. Some of these districts’ students are traveling an hour on average just to get to school. In Forest Area SD’s case, transportation takes up 12% of the budget.
This problem of transportation cost is an economy of scale. The fewer the students, the higher cost. Research has found that costs level out if a district enrolls 2,000 students. But below that, many costs go up.
Staffing is one such issue. These districts have a hard time finding the right people to teach in rural areas and they cannot offer competitive salaries and benefits given lower funding. Yet they need the staffing despite their low density. One witness points out that you need a physics teacher no matter how many students you have.
Are these districts underfunded now?
The state government reformed Pennsylvania’s school funding formula in 2015. These numbers could be old. Are the small rural school districts mentioned in the report still underfunded?
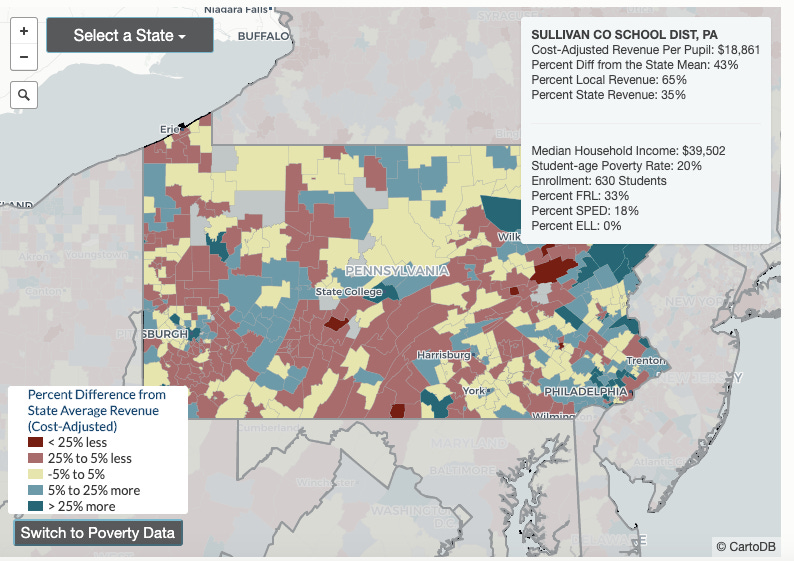
My favorite resource for mapping school district funding inequality is EdBuild. They closed shop this year, but they kept their maps online and they’re super helpful.
Not all rural schools are in a bad spot funding-wise. Sullivan County SD in northeast-central PA is actually doing pretty well. They’re getting 35% help from the state and, with a median household income of less than $40,000 (and a poverty rate of 20%) they’re getting almost $19,000 per pupil. That’s actually 43% above the state mean.

But not all small rural districts have it as good as Sullivan. Turkeyfoot Valley Area SD has the same amount of student poverty at 19%, a similar median household income, but has fewer students than Sullivan (430). It’s per pupil funding is $11,000, which is 11% below the state mean.

You can see from EdBuild’s maps that there are large swaths of rural area in PA that are in the red like Turkeyfoot Valley. These are the rural districts we would want to build coalition with.
Below is a table with a selection of rural districts, their resource inequality (measured in relation to average district revenue), along with their state house representatives.
These school districts all have -15% or below the state average for district revenue. They’re underfunded. It could be interesting to have organizing conversations with these representatives and feel them out for their interest in better terms given their districts’ revenues.


